
Infrastructure
Starting a new installation of SQL Server 2019 Enterprise (15.0.2000.5 / X64 on Windows Server 2019 Standard 10.0 / Build 17763) on a new physical machine (2 machines for AlwaysOn replicas).
The new machines are a LENOVO :
* ThinkSystem SR630 – [7X02CTO1WW]
* 1 CPU : 1 Xeon Gold 6208U – 2.90 Ghz (16 cores x 2 – hyperthreading)
* 256 Gb RAM (32 Gb x 8)
There are 2 new identical machines and the problem appears systematically on the 2 machines…
The tests that generate the malfunctions are as follows:
1) creation of a database
2) enlarging the database files and switching to SIMPLE recovery mode
3) creation of a table
4) filling the table with 1 million rows
5) execution of the test request (calculation of aggregated time intervals – collapsing)
It is this query (executed almost 10 times) which very often goes into error with the following message:
Msg 601, Level 12, State 1, Line … Could not continue scan with NOLOCK due to data movement.
Of course, at no time did we implement the NOLOCK hint or the READ UNCOMMITTED isolation level.
But… information is written to the SQL Server event log:
1) time-out for buffer latch in pages of tempdb
2) sometimes a dump is generated
Example of « buffer latch » messages :
A time-out occurred while waiting for buffer latch — type 4, bp 00000292CE3D60C0, page 9:18634, stat 0x10b, database id: 2, allocation unit Id: 422212527063040/140737550352384, task 0x00000292AB073468 : 9, waittime 300 seconds, flags 0x100000001a, owning task 0x00000292AB06B848. Not continuing to wait.
A time-out occurred while waiting for buffer latch — type 4, bp 00000292CE398340, page 6:10372, stat 0x10b, database id: 2, allocation unit Id: 422212527063040/140737550352384, task 0x00000292AB07B468 : 8, waittime 300 seconds, flags 0x1a, owning task 0x00000292AB073468. Not continuing to wait.
A time-out occurred while waiting for buffer latch — type 4, bp 00000292CE3DC480, page 9:18655, stat 0x10b, database id: 2, allocation unit Id: 422212527063040/140737550352384, task 0x00000292AB703C28 : 12, waittime 300 seconds, flags 0x1a, owning task 0x00000292AB07B468. Not continuing to wait.
Our investigations:
* Installing CU6 and after CU7 does not solve the problem
* Disk failure has been sweep of, because we create the database on the 3 differents hard disk drives and the problem remains, even when we move the tempdb.
* The « buffer latch » information indicate likely a memory fault. But no hardware informations appear about the RAM in the servers.
* While soft NUMA is enable, we do complementary tests by disabling SOFT NUMA, but is does not solve the problem.
Some elements that seems to decrease the occurrence of the phenomenon:
1) disabling SOFT NUMA (with hyperthreading enabled): the first 3 test are successes and last 7 are failure
2) disabling hyperthreading (with SOFT NUMA disabled): on 10 tests only 1 is a failure
3) disabling hyperthreading (with SOFT NUMA enabled): on 90 tests only 1 is a failure
Some elements that seems to solve the problem:
1) setting MAXDOP 1
2) recomputing statistics (UPDATE STATISTICS T_TIME_INTERVAL_TIV WITH FULLSCAN;)
Perhaps something to do with the new « Concurrent PFS updates » of SQL Server 2019 ?
========== SCRIPT ==========

-- 1) creating database
CREATE DATABASE DB_BENCH
GO

DECLARE @SQL NVARCHAR(max) = N'';
SELECT @SQL = @SQL + N'ALTER DATABASE DB_BENCH MODIFY FILE (NAME = ''' + name + N''', SIZE = 10 GB, FILEGROWTH = 64 MB);'
FROM DB_BENCH.sys.database_files;
SET @SQL = @SQL + N'ALTER DATABASE DB_BENCH SET RECOVERY SIMPLE;'
EXEC (@SQL);
GO

USE DB_BENCH
GO

-- 2) creating table and view
CREATE TABLE T_TIME_INTERVAL_TIV
(TIV_ID       INT NOT NULL IDENTITY PRIMARY KEY,
 TIV_GROUP    INT,
 TIV_DEBUT    DATETIME2(0),
 TIV_FIN      DATETIME2(0))
GO

CREATE VIEW V
AS
SELECT TIV_GROUP AS id, TIV_DEBUT AS intime, TIV_FIN AS outtime
FROM   T_TIME_INTERVAL_TIV
GO

-- 3) inserting datas
TRUNCATE TABLE T_TIME_INTERVAL_TIV;
GO

BULK INSERT T_TIME_INTERVAL_TIV
FROM "C:\DATA_SQL\intervals.txt"
WITH (KEEPIDENTITY , FIELDTERMINATOR = '\t',
      ROWTERMINATOR = '\n');
GO

-- 4) testing
SET NOCOUNT ON;
GO

SET STATISTICS TIME ON;
GO

WITH T1 As
(SELECT id, intime
 FROM   V
 UNION  ALL
 SELECT id, outtime FROM V),
T2 As
(SELECT ROW_NUMBER() OVER(PARTITION BY id ORDER BY intime) NN, id, intime
 FROM   T1 T1_1),
T3 As
(SELECT T2_1.NN - ROW_NUMBER() OVER(PARTITION BY T2_1.id ORDER BY T2_1.intime,T2_2.intime) NN1,
        T2_1.id, T2_1.intime intime, T2_2.intime outtime
 FROM   T2 T2_1
        INNER JOIN T2 T2_2
              ON T2_1.id=T2_2.id
                 And T2_1.NN=T2_2.NN-1
 WHERE  EXISTS (SELECT *
                FROM   V S
                WHERE  S.id=T2_1.id
                  AND  (S.intime < T2_2.intime AND S.outtime>T2_1.intime))
    OR  T2_1.intime = T2_2.intime)
SELECT id, MIN(intime) intime, MAX(outtime) outtime
FROM   T3
GROUP  BY id, NN1
ORDER BY id, intime, outtime;

========== END OF SCRIPT ==========
Complementary test (2020-09-29)
On september 2020 the 29th, we decided to decrease the number of datafile of tempdb to 1. Setting MAXDOP = 7 on the 16 cores / 32 virtual cores (hyperthreading) the bug occurs systematically
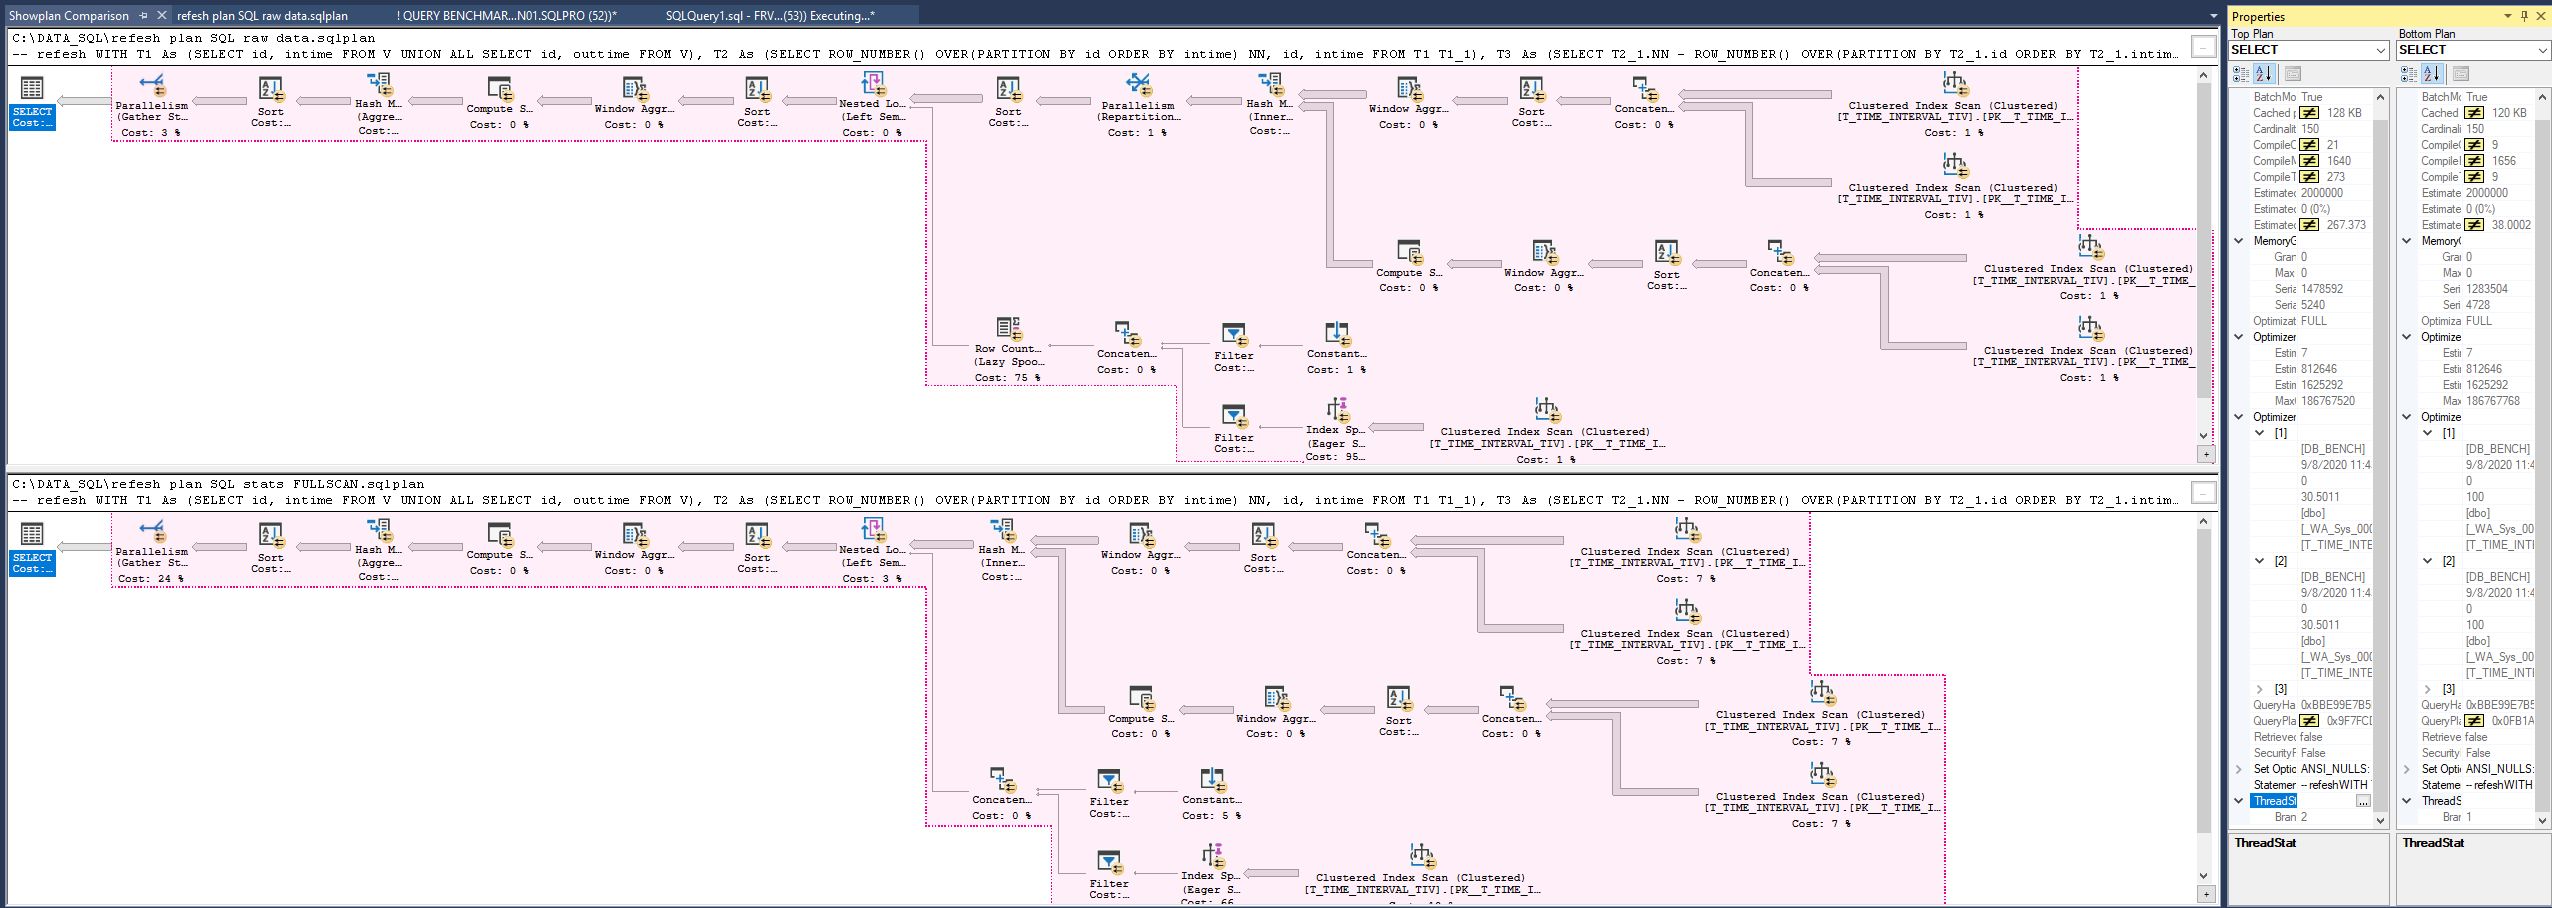
========== PLAN COMPARISON ==========
As an information, estimated plans, compared between raw execution and after a
« UPDATE STATISTICS T_TIME_INTERVAL_TIV WITH FULLSCAN; » :
========== FILES ==========
File to execute the script:
1) data
https://1drv.ms/t/s!AqvZfiQYoNpBiCD65D4zaRbch5s-?e=UicEYu
2) dump 0005 SQL Server
2.1 – log
https://1drv.ms/u/s!AqvZfiQYoNpBiCPGQ-0QoYbLZY0I?e=sPOwIh
2.2 – mdmp
https://1drv.ms/u/s!AqvZfiQYoNpBiCQzFWYNscBA2wR6?e=vWTdo0
2.3 – txt
https://1drv.ms/t/s!AqvZfiQYoNpBiCEjKy4K5nyv-mfP?e=AbtU4S
2.4 – SQLDUMPER_ERRORLOG.log
https://1drv.ms/u/s!AqvZfiQYoNpBiCIqUVJnczga3kn_?e=DbA8if
3) Query plans
3.1 – raw data:
https://1drv.ms/u/s!AqvZfiQYoNpBiCaLh_oQCho2u_WZ?e=tWVrve
3.2 – after a UPDATE STATS in FULLSCAN mode:
https://1drv.ms/u/s!AqvZfiQYoNpBiCUDUQwAwqgwOBAJ?e=Q1fJRO
3.3 – Comparison of the two plans:
https://1drv.ms/u/s!AqvZfiQYoNpBiCffhVO_PjBNXpOX?e=dZk4Qm
++++++++++ NOTE ++++++++++
We posted in stackoverflow without any success…
https://stackoverflow.com/questions/63702369/msg-601-could-not-continue-scan-with-nolock-due-to-data-movement-but-nolock
And in dba.stackexchange…
https://dba.stackexchange.com/questions/275487/2019-enterprise-nolock-without-nolock-page-latch-time-out-on-tempdb-and-final